Unit 5a. Population Dynamics: Predator-Prey Interactions
 Objective
The purpose of this exercise is to develop an understanding of population dynamics by modeling the dynamics of a hypothetical population. After we have established basic population dynamic relationships, you will investigate these relationships in greater detail by exploring the population dynamics of a hypothetical predator - prey population of foxes and rabbits.
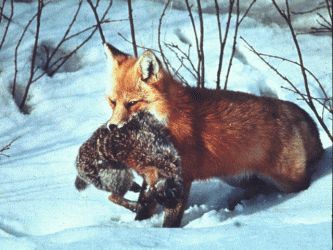
Figure 5.a.1
Fox predator catching a prey rabbit
An effective means of understanding such a system is to model it, i.e. to think about the system critically, identifying stocks, flows, converters and connectors, and create a conceptual diagram. You will be given a description of the system, and some initial parameters. You will then develop a conceptual diagram together in groups. This diagram will serve to summarize our knowledge of the system, and convert descriptive information into symbols that are easy to manipulate. From the conceptual diagram, the descriptive data, and some initial parameters, you will construct a STELLA model that describes the rabbit-fox population dynamics.
Population Dynamics
In this lab we will be considering foxes and rabbits. We need to first examine the basics of population dynamics using the rabbit population to examine how populations change over time. Start up STELLA and click on the globe icon so that it changes to a X2 (Chi-square) symbol to begin modeling.
The first stock ![]() in our
model is Rabbits.
in our
model is Rabbits.
Recall that changes in stocks are modeled with the flow tool: ![]() .
Changes in population are caused by Births, so add it to your model.
.
Changes in population are caused by Births, so add it to your model.
The final piece needed for a complete model is the Rabbit
Birth Rate. Add this using the converter
tool: ![]() .
Assume that the rabbit birth rate is 4% per year or .04 and your population
starts with 10 rabbits.
.
Assume that the rabbit birth rate is 4% per year or .04 and your population
starts with 10 rabbits.
Use the connector tool: ![]() to complete the connections in your population model.
to complete the connections in your population model.
Define births with the following equation:
Births=Birth Rate*Population
SAVE your model.
Specify an amount of time for the model under length of simulation:
From = 0, to = 250, DT = 1, and Unit of Time = years. Click OK.
Set up the viewing graph with the graph icon ![]() .
Define your graph with the Rabbit Population stock. Run the model.
.
Define your graph with the Rabbit Population stock. Run the model.
The graph that appears should look like Figure 5.a.2.
Figure 5.a.2
Graph of exponential population growth
A More Realistic Model
The model we have created works well, but recall that all populations have limits to their growth. How can we fix the model to give a more realistic result? We can show this effect in our model by adding a carrying capacity variable and changing the equation for Births.
Add a converter to the model, below and to the right of the flow icon, and name it Carrying Capacity. Connect it to births. What would be a good value for carrying capacity for your population?
Change your equation to include the carrying capacity component of your model.
Births = Birth Rate*Population*(1 - (Population/ Carrying Capacity))
The model should now look like Figure 5.a.3.
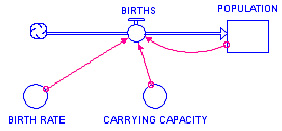
Figure 5.a.3
Population model with carrying capacity
Run the model with the same time specs. The new graph should look like Figure 5.a.4.
Figure 5.a.4
Graph of population with carrying capacity
Judging by the graph, this model seems to be more in line with the way a population might increase in an environment with finite resources.
Rabbits and Foxes
Now that we have an understanding of basic population dynamics we need to explore this further by exploring the relationship between a hypothetical population of predator and prey species. First we have to describe how the prey (rabbit) population changes and then describe how the predator (fox) population subsequently changes, since the predator is dependent on the prey species for growth and survival. Below is the information you have at your disposal to develop your new model.
- The rabbit population tends to exhibit exponential growth unless it is held in check by a predator.
- Rabbit mortality is determined entirely by fox predation.
- Foxes eat rabbits at a rate proportional to the number of encounters between foxes and rabbits.
- Fox population growth rate is determined by the amount of rabbits they eat (foxes tend to reproduce faster if they are well fed) and their physiological efficiency of converting energy gained by ingestion of prey to reproduction (simply put: the efficiency of converting eaten rabbits into new baby foxes).
- Natural death processes determine Fox mortality.
- Also at your disposal are data describing the rates at which these processes occur. Normally, researchers would determine these rates experimentally.
- The growth rate of the rabbit population in the absence of predation is 4% / year (0.04).
- The foxes' physiological efficiency of converting ingested rabbits to new offspring is 3% (0.03).
- The natural death rate of foxes is 4% (0.04) / year.
- The rate of fox predation on rabbits is 0.05% (.0005) / year.
You now have a written description of how this system works as well as some data on the rates of the processes. The next step is to turn these data into a conceptual diagram. This diagram allows you to see, using symbols, how parts of the model relate to one another. It is the intermediate step in understanding the dynamics and should serve as the template for your STELLA model.
You will develop the conceptual diagram in a small group of 2 or 3 students. Once this diagram is clear, you can start building your model. Run your model for 500 years at a time step (DT) of 1.0 with an initial population of 1000 rabbits and 100 foxes.
In building your model, you should have an idea of what the outcome should be. In other words, how do you think the fox population should grow in relation to the rabbit population? Sketch out a quick graph of your expectations and ask yourself "why should it look this way and how might it look different?" This should help you figure out whether or not the model is functioning well.
Troubleshoot and Revise
Here are some tips to help exterminate the bugs in your model:
- Make sure that there are no typos in your model. You should not type in any variable names when defining flows; instead select them from the list on the left box.
- Are your parentheses correct and balanced?
- If you can't enter formulas, are you in modeling mode?
- Make sure that you have the flows going in the correct direction.
- Make sure the connectors between the icons exist and are connected to the correct icons.
- No graph appears when running? Have you defined the graph? Do you need to manually set the scale of the Y-axis so that the curves are scaled properly?
- Test and revise the model until it is running correctly.
Questions
Question 5.a.1
Describe the dynamics of both
populations under the conditions outlined above and discuss why this pattern
occurs. Submit a copy of the model, the equations and a graph of the run.
Question 5.a.2
What parameter value(s) would you change to have the fox population crash (go to zero), and the rabbit population survive? Test your prediction and include your graph in your submission.
Question 5.a.3
What parameter value(s) would you change to have the rabbit population crash? How would this affect the fox population? Test your prediction and include your graph in your submission.
Question 5.a.4
What would you expect to happen (in terms of the dynamics of both populations) if rabbits exhibited logistic (s-shaped) growth? Test this out by modifying your model and adding this feature to the rabbit population. Select a carrying capacity that you feel is reasonable. Explain the dynamics, and include the associated graphs in your submission.
Sources
http://www.canids.org/SPPACCTS/redfox.htm