Unit 4a. Biological Productivity and Trophic Systems
 Objective
The goal of this lab is to explore the flow of energy in ecosystems. Energy is used and lost as heat as it moves through ecosystems, and new energy is continually added to the Earth in the form of solar radiation. The objective of the lab is to model a simple trophic system consisting of grass, hares, and foxes to understand how energy is lost as we move up through the trophic system. This will also help us to determine how much energy is available to each trophic level as we move through a system.
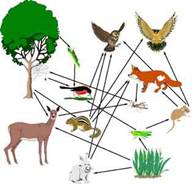
Figure 4.a.1
Terrestrial food web
Autotrophs verses Heterotrophs
Some organisms are capable of synthesizing organic molecules from inorganic precursors, and of storing biochemical energy in the process. These are called autotrophs, meaning "self-feeding." Autotrophs also are referred to as primary producers. The process by which they do this usually is photosynthesis, and as its name implies, photosynthesis requires light (Figure 4.a.2).
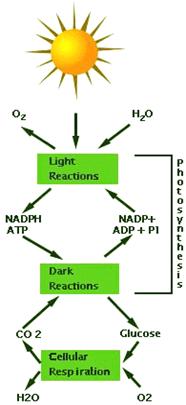
Figure 4.a.2
Photosynthesis
Photosynthesis stores energy in the form of sugar.
6 CO2+ 6 H2O à sunlight à C6H12O6 + 6 O2
Cellular respiration is the reverse process from photosynthesis and releases it for use in functions such as reproduction and basic maintenance. In the process, metabolic work is done and energy in chemical bonds is converted to heat energy.
C6H12O2 + 02 à 6 CO2 + 6 H2O + Heat
Many organisms can only obtain their energy by feeding on
other organisms. These are called heterotrophs.
These organisms are also called consumers because they rely on plants, animals,
microbes, or dead tissue for energy.
The Process of Primary Production
The general term production is the creation of new organic matter. Whether one measures the rate that photosynthesis occurs, or the rate that the individual plant increases in mass, one is concerned with primary production. Consumers derive their energy from primary producers, either directly (herbivores), or indirectly (predators). When calculating the amount of energy that a plant stores as biomass, which is then available to heterotrophs, we must subtract plant respiration costs from the total primary production.
Some Definitions
- Gross Primary Production, or GPP, is the total amount of CO2 that is fixed by the plant in photosynthesis.
- Respiration, or R, is the amount of CO2 that is lost from an organism or system from metabolic activity. Respiration can be further divided into components that reflect the source of the CO2.
- Net
Primary Production, or NPP, is the net amount of primary
production after the costs of plant respiration are included. Therefore, NPP
= GPP - R
The Transfer of Energy to Higher Trophic Levels
As energy passes from one trophic level to another, the following rules apply:
- Only a fraction of the energy available at one trophic level is transferred to the next trophic level. The rule of thumb is 10%, but this is very approximate.
- Typically the number and biomass of organisms decrease as one ascends the food chain.
To understand these rules, we must examine what happens to energy within a food chain. Suppose we have a system where some amount of plant matter is consumed by hares. Foxes then consume the hares. Figure 4.a.3 illustrates how this works in terms of the energy losses at each level.
Figure 4.a.3
Energy loss through trophic levels
A hare (or a population of hares) ingests plant matter; we'll call this ingestion. Part of this material is processed by the digestive system and used to make new cells or tissues, and this part is called assimilation. What cannot be assimilated, for example maybe some parts of the plant stems or roots, exits the hare's body and this is called excretion. Thus we can make the following definition:
Assimilation = (Ingestion - Excretion).
The efficiency of this process of assimilation varies in animals, ranging from 15-50% if the food is plant material, and from 60-90% if the food is animal material.
The hare uses a significant fraction of the assimilated energy for maintenance. In example, maintaining a high, constant body temperature, synthesizing proteins, and hopping about. This energy used (lost) is attributed to cellular respiration.
The remainder goes into making more hare biomass by growth and reproduction. The conversion of assimilated energy into new tissue is termed secondary production in consumers, and it is conceptually the same as the primary production or NPP of plants. The secondary production of the hare is the energy available to foxes that eat the hares for their needs. Clearly, because of all of the energy costs of hares engaged in normal metabolic activities, the energy available to foxes is much less than the energy available to hares.
In general, only about 10% of the energy consumed by one level is available to the next. For example, if hares consumed 1000 kcal of plant energy, they might only be able to form 100 kcal of new hare tissue. For the hare population to be in steady state (neither increasing nor decreasing), each year's consumption of hares by foxes should roughly equal each year's production of new hare biomass. So the foxes consume about 100 kcal of hare biomass, and convert perhaps 10 kcal into new fox biomass. In fact, this ecological efficiency is quite variable, with warm-blooded animals (homeotherms) averaging 1- 5% and cold-blooded animals (poikilotherms) averaging 5-15%. The overall loss of energy from lower to higher trophic levels is important in setting the absolute number of trophic levels that any ecosystem can contain.
Thus, the mass of foxes should be less than the mass of hares, and the mass of hares less than the mass of plants. Generally this is true, and we can represent this concept visually by constructing a pyramid of biomass for any ecosystem (Figure 4.a.4).
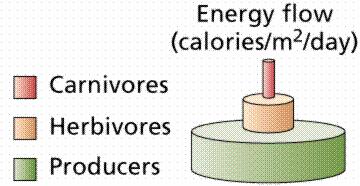
Figure 4.a.4
Biomass pyramid of producers, herbivores and carnivores
Modeling the Fox and Hare: an Example of Trophic Systems
Create a model of the movement of the primary production through a simplified planet consisting of vegetation, hares, and foxes. Figure 4.a.3 will be useful to you throughout this process.
Helpful Hints
Start your model with the stocks, then add flows, and finally add converters and connectors.
Use {} in your STELLA equations to keep track of units.
Stock #1: Grass Productivity
Initial Value = 4.95*10^6 {gigatons}
Inflows
- Photosynthesis = 0.51*Grass_Productivity {gigatons/yr.}
Outflows
- Respiration = Grass_Productivity*0.49 {gigatons/yr.}
- Secondary Assimilation of Grass = Assimilation Efficiency of Grass {gigatons/yr.}
Converters
- Assimilation Efficiency of Grass = Grass_Productivity*0.6 {gigatons/yr.}
Stock #2: Hare Productivity
Initial Value =4.95*10^6 *0.1{gigatons}
Inflows
- Secondary Assimilation of Grass = Assimilation Efficiency of Grass {gigatons/yr.}
- Ingestion of Grass = Secondary_Assimilation_of_Grass*0.1 {gigatons/yr.}
Outflows
- Excretion and Heat Loss Hares = 0.675*Hare_Productivity {gigatons/yr.}
- Secondary Assimilation of Hares = Assimilation Efficiency of Hares {gigatons/yr.}
Converters
- Assimilation Efficiency of Hares = 0.325*Hare_Productivity {gigatons/yr.}
Stock #3: Fox Productivity
Initial Value = 4.95*10^6*0.1*0.1{gigatons}
Inflows
- Secondary Assimilation of Hares = Assimilation Efficiency of Hares {gigatons/yr.}
- Ingestion of Hares = Secondary_Assimilation_of_Hares*0.1 {gigatons/yr.}
Outflows
- Excretion and Heat Loss Foxes = Fox_Productivity*0.25 {gigatons/yr.}
- Secondary Assimilation of Foxes = Assimilation Efficiency of Foxes {gigatons/yr.}
Converters
- Assimilation Efficiency of Foxes = 0.75*Fox_Productivity {gigatons/yr.}
The first trophic level of your model should look like Figure 4.a.5.
Figure 4.a.5
Primary production or first trophic level of the STELLA model
When you have completed the model, set the time specs to run for 5 years. Then create a graph of the productivity of Grass, Hares and Fox stocks over time.
Question 4.a.1
What happens over time in your model? Why? How could this be changed?
Create a bar graph to look at the productivity of Grass, Hares and Foxes. Click on define graph, then at the top of the box, choose bar graph and choose what components of your model you want to graph. Set your time specs to only run for 0.25 years. Set your DT to 0.25
Question 4.a.2
How does the productivity change as you move through the food web?
Question 4.a.3
How many trophic levels can our system support? Could this system support a tertiary consumer such as a wolf?
Question 4.a.4
What assumptions have we made for the model? Are they realistic?
Sources
http://www.bigelow.org/edhab/images/food_web.jpg