Unit 2b. Distribution and Economic Impact of Natural Disasters
 Objective
The goal of this lab is the investigate the distribution of volcanoes and earthquakes in relation to population to determine which populations are most at risk for large-scale natural disasters. We will explore USGS ArcGIS data that has a detailed history of global active volcanoes as well as earthquakes. We will examine data to locate the largest and most destructive earthquakes and volcanoes. We will also explore what factors contribute to their destructive potential and examine the relationships between population, wealth, and hazard risk.
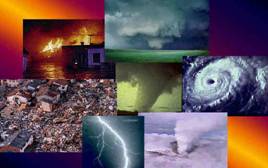
Figure 2.b.1
Disasters
Earthquakes
Forces in the Earth create an environment where parts of the surface grind past other parts. The boundaries between such moving parts are called faults. It is the catastrophic displacement of a fault that generates an Earthquake. These stresses often occur at the edges of plates, where plates slide past one another, move apart, or collide.
 Divergent boundaries are locations where new crust is
generated as the plates pull away from each other. Convergent boundaries are places where crust is destroyed as one
plate slides under another, often with mountain ranges forming at the impact
point between plates. Transform boundaries
are locations where crust is neither produced nor destroyed as the plates slide
horizontally past each other.
Divergent boundaries are locations where new crust is
generated as the plates pull away from each other. Convergent boundaries are places where crust is destroyed as one
plate slides under another, often with mountain ranges forming at the impact
point between plates. Transform boundaries
are locations where crust is neither produced nor destroyed as the plates slide
horizontally past each other.
An Earthquake is the sudden release of stress that results
from the slow accumulation of pressure on cold, brittle rocks. Take for example a thin piece of wood. You
can bend the wood a little, but eventually it snaps. The ability to bend is an
elastic property of a material, and when it snaps you have exceeded its elastic
limit. The same applies to geological faults. Rocks are only able to accumulate
a certain amount of elastic energy, what we call elastic strain energy. When
you exceed this energy, the rock breaks, much like a ceramic plate breaks when
it hits the floor.
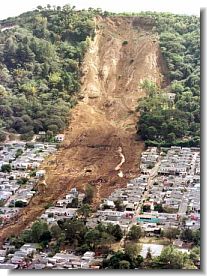
Figure 2.b.2
Landslide caused by an Earthquake
The magnitude of an Earthquake is determined by rock strength and how much rock is broken during an event. The more energy released, the greater the Earthquake magnitude. If the rock is heated it can stretch and change slowly over time without breaking. Typically rocks below 20-30 km are warmer than more shallow rocks and when they are stressed they deform rather than break.
Open the Inquiries.mxd ArcGIS file. Save the file under a new name. Copy and paste (Right-click à Copy, Edit à Paste) the Significant Quakes theme and Quakes 1973-2003 to the top of the theme column. Next, copy and paste the Urbanization theme below the quakes themes. Click on the box next to the Urbanization theme active, to make the map of the world appear.
Double-click on the Urbanization theme to open the layer properties window. We want to start by creating a map that explores global population to examine how the distribution of global populations influences Earthquake risk. Under the Symbology tab select 2000 Total Population as the classification field value.
Select the yellow to brown color ramp, or another ramp of your choosing that displays the trends in population in an easily understandable way. Finally, press the Classify button and under type choose Natural Breaks and under Number of Classes choose 5. Once you have finished press Apply and close that window. You should now see a map of the world with each country coded in color by the total population in 2000.
Now activate the Quakes 1973-2003 theme by checking the box next to the theme. This theme shows all earthquakes between 1973 and 2003 that were magnitude 4 or greater. Your map should look like Figure 2.b.3.
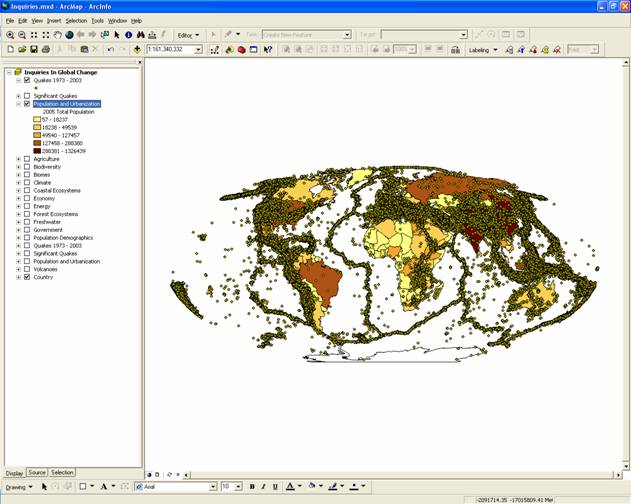
Figure 2.b.3
Total Population and 30 years of earthquakes
Look at your map and compare it to Figure 2.b.4 below.
Figure 2.b.4
Tectonic plates of Earth
Question 2.b.1
What relationship do you see between 30 years of Earthquake data and Figure 2.b.4?
Question 2.b.2
What countries seem to be at high risk from earthquakes?
Now deactivate the Quakes 1973-2003 theme and activate the Significant Quakes theme. This theme maps historically significant earthquakes over the past 1500 years. Double-click on the Significant Quakes theme to open the layer properties window and under the Symbology tab, in the left side box, select Graduated symbols under Quantities for the Legend Type. Choose Magnitude as your classification field value. Next, change your symbol size to vary between 1 and 8. Select five natural breaks for the classification, such as in Figure 2.b.5.
Next, right-click on the symbols and select properties for all symbols and choose a color for the earthquakes such as blue and select OK. Then right-click on the largest earthquake symbol and select Properties for Selected Symbol(s) and make this category a different color such as red so you can tell the difference between magnitude classifications. If you prefer, you can make each magnitude classification a different color.
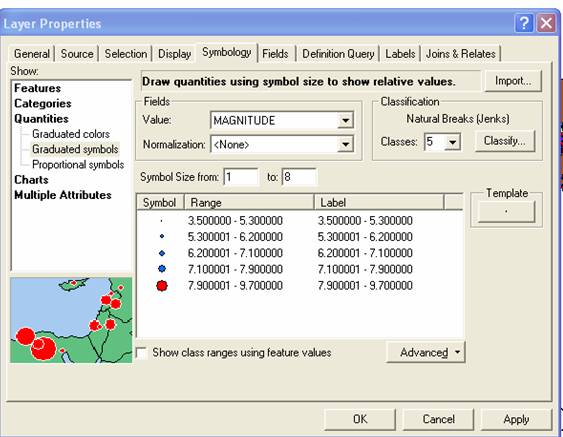
Figure 2.b.5
Classification of earthquake magnitude categories
Next, examine all recent and historical extreme earthquakes, or those with a magnitude of 8 or greater. To do this, copy the Significant Quakes theme and paste it at the top of the themes column. Rename this theme Extreme Quakes >=8 by opening the layer properties window and under the General tab altering the theme name. Deactivate the original Significant Quakes theme.
Use a Definition Query to figure out which historical earthquakes had a magnitude of 8 or greater. The query will highlight all of the features that match your specifications. To select only quakes with a magnitude greater than 8 on the Richter scale, build a query. Under the Definition Query tab, click on the Query Builder button. Then, build the query [MAGNITUDE] >=8. Make sure to use the >= button for the query. Click OK twice to display only the selected earthquakes.
Next, add to the magnitude 8 or greater quakes by creating a Definition Query for the Quakes 1973-2003 using the same process as for the Significant Quakes theme. Name the new theme Quakes >=8 1973-2003. Make sure to differentiate between the historical quakes and the more recent quakes by altering the symbols.
Question 2.b.3
How does total population compare to the location of extreme earthquakes? Which countries are at high risk of having large numbers of people affected by extreme earthquakes?
Question 2.b.4
Choose one of the earthquakes that occurred between 1973-2003 with magnitude 8 or greater and explore it in more detail. Use the identify results function to get information about the Earthquake of your choice. Then do an internet search and obtain damage and death information about your Earthquake. Write a short paragraph about what you found.
Next, examine how urbanization rates may alter a country’s
earthquake hazard risk by examining the predicted future increase in percent
urbanization over time. Open the layer properties window for the Urbanization theme. Change the
classification field value to 2000
Percent Urban Population and classify the data by six natural breaks. Click
on the classify button and write down the first five break values of the 2000 Percent Urban Population.
Now, insert a new data frame into ArcGIS by selecting Insert à Data Frame. This process facilitates examining multiple maps concurrently. Click on the new data frame name and change it to Future Urbanization. From the Inquiries in Global Change Data Frame, drag down the Quakes >=8 1973-2003, Extreme Quakes >=8, Urbanization and Country themes to the new data frame.
Next, select View à Layout View. The themes that are active in each data
frame should be visible in the middle of the layout page. Next, resize both
frames so they are the same size and do not overlap on the page. Use the Zoom
tool to enlarge the maps inside the layout frame box.
Then set the map projection of the new frame so that the new
frame can have the same projection with the Inquiries In Global Change frame.
Right-click on the new data-frame and choose properties from the menu. Select the Coordinate System tab, and in the
box showing the coordinate system trees, click the following links to find the
coordinates system desired: Predefined > Projected Coordinate System >
World > Flat Polar Quartic (world). Click OK. A
warning box may appear, and if it does click on the Yes button. The new data
frame map should change shape to match the Inquiries
In Global Change data frame map.
In the Future Urbanization data frame, open the layer properties window and under the Symbology tab change the classification field value to 2030 Percent Urban Population. Classify the data as 6 natural breaks, then click on the classify button and change the first five break values (box on the right) to those that you recorded from the 2000 Percent Urban Population theme. When you are finished, click on the OK button two times.
Using the insert button, Insert appropriate titles and legends on your layout. When you are happy with your layout, save your map as a JPEG and turn it in with your homework. To do this, go to File à Export. Under List Files of Type: choose JPEG. Choose a place to save your map and give it an appropriate filename. Once you have saved your map open up the JPEG to check the map.
Question 2.b.5
Do you think that a countries ratio of rural to urban population, or percent urban population, affects its earthquake hazard risk? Please explain your answer.
Volcanoes
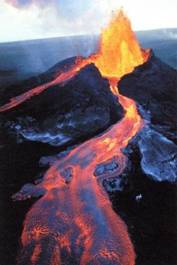
Figure 2.b.6
Volcano
Volcanoes generate a wide variety of phenomena that can alter the Earth's surface and atmosphere and endanger people and property. Small events may pose hazards only within a few miles of a volcano, while large events can directly or indirectly endanger people and property tens to hundreds of miles away. Volcanoes develop where molten rock from within the Earth, rises to the surface and creates new lithosphere.
Ridge volcanoes occur when spreading ridges allow magma to rise and break through the ocean floor along cracks or fissures. Magma fills in the cracks and forces the ridges to spread. Isolated volcanoes are generally created by "hot spots", which occur due to hot plumes of magma rising toward the surface from within the mantle. Volcanoes also occur at subduction zones where high density oceanic lithosphere is recycled into the mantle while lower density continental lithosphere is compressed.
Return to the data view, by selecting View à data view. Make sure that the Inquiries in Global Change data frame is active, or in bold. If it is not, right click on the data frame name and select Activate. Next, activate the Volcanoes theme and move it to the top of the theme column keeping the other queries activated. Note that you may want to right-click on your volcano symbol and change the color or symbol type for better viewing.
Question 2.b.6
Look at the relationship between earthquakes and volcanoes. Where do most volcanic eruptions occur? Why? Please be specific.
Question 2.b.7
Look at
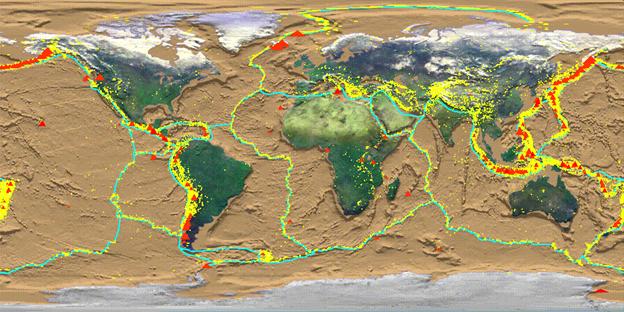
Figure 2.b.7
Map of volcanoes, earthquakes, and plate boundaries.
Next, copy the Urbanization
theme and paste it at the top of the theme column. Change the name of the Urbanization theme to Population
Density. Next, open the layer properties window and under the Symbology
tab, select 2000 Total Population as the classification field value and
normalize it by Area. Choose four Quantiles as your
classification type. Your map should look something like Figure 2.b.8.
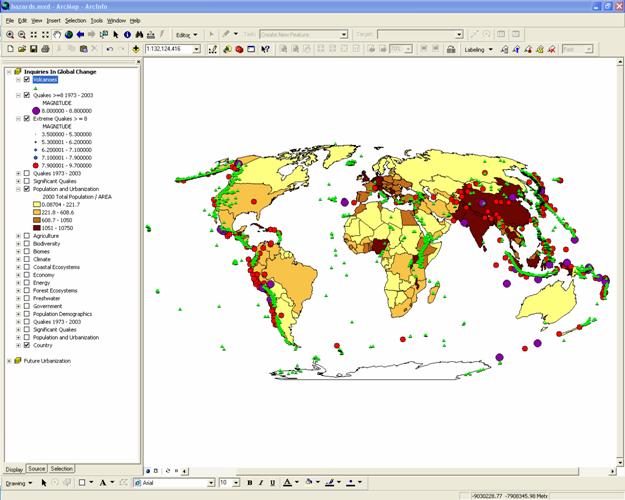
Figure 2.b.8
Map of volcanoes
Question 2.b.8
How does population density compare to the location of volcanic eruptions? Why might this be the case? Hint: over time volcanic rock breaks down into what?
Economic Factors
A country's wealth has a remarkable effect on its ability to plan for, endure and recover from a natural disaster. Explore the relationship between per capita Gross Domestic Product (GDP) and the distribution of earthquakes and volcanoes.
Economic Costs of Great Natural Disasters (US$billion),
1950-2000
Figure 2.b.7
Economic cost of natural disasters from 1950-2005
http://www.unep.net
Deactivate your Urbanization theme. Copy the Economy theme and paste it below the Earthquake and volcano themes. Rename the new theme Per Capita GDP and activate it. Use Per Capita GDP in 2000 (Pc_gdp00) as the Classification Field Value. Choose yellow to brown dichromatic for the Color Ramp or another of your choosing. Choose eight natural breaks as your classification type. Look at the global distribution of per capita wealth in relation to large-scale earthquakes and volcanoes.
Question 2.b.9
Taking into account population and economy, which countries are most at risk for earthquakes? Which are most at risk from volcanoes?
Question 2.b.10
The magnitude of a disaster often depends on the proportion of income and resources the people, region, or country has access to. How can we protect the people that are most vulnerable to disasters, which are disproportionately poor people, women, children and minorities?
Background Reading
Averting Unnatural Disasters Chapter 7, 2001 State of the Planet p. 123-142, by the WorldWatch Institute.
Sources
Some ideas for ArcGIS activities taken from: Hall-Wallice
MK, Walker CS, Kendall LP, Shaller CJ and Butler RF.
(2003) Exploring the Dynamic Earth. GIS Investigations for the Earth Sciences. Brooks/Cole. Editor K Dodson.
Source:
http://pubs.usgs.gov/publications/text/dynamic.html
http://www.geo.utep.edu/kidd/Vol_eq_plates.html
http://biblia.com/disasters/volcano-30g.jpg
http://www.kidskonnect.com/NaturalDisasters/disastNature.jpg
http://www.santegidio.org/img/salvador/terremoto01.jpg