 Unit
2a. Modeling the Impact
of Disasters
Unit
2a. Modeling the Impact
of Disasters
Objective
Over the past fifty years, the amount of money that has been spent on disasters has increased dramatically (Figure 2.a.2). The goal of this lab is to investigate the impact of natural and anthropogenic disasters on a hypothetical human population and the economy associated with that population.
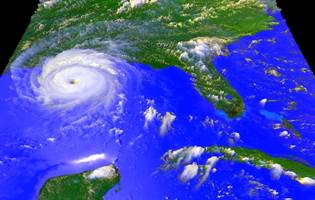
Figure 2.a.1
Hurricane in the
Introduction to Concepts and Model
Assumptions
Economy
There are a number of resources that a country draws upon to establish and to maintain an economy. Classical economics considers natural resources, human resources and capital as three components of an economic system that circulates the flow of goods and services.
Figure 2.a.2
Summary of economic losses due to natural disasters between 1950 and 2005
Natural resources provide all of the raw materials needed for goods and services, as well as absorbing wastes and pollution created by that economy. For example, some renewable natural resources might include tangible resources like forests, fisheries, agricultural soil, and water, or they might include intangible resources such as climate regulation and waste absorption. Unfortunately, natural capital can be depleted or overspent. This may occur when the population increases beyond the capacity of the land to support it or depletion can occur if a population consumes more resources than the land can provide.
Human resources include human capital, social capital, and knowledge assets. Human capital refers to the abilities and talents of the population. Education increases human capital. Social capital includes government, laws, and civil liberties that societies create to provide order to the system. Knowledge assets include written knowledge that can be transferred to others. Libraries, universities, and the internet, would all be considered knowledge assets.
In the model we will only consider human capital and natural capital. We will aggregate human capital, social capital, and knowledge assets into one component called human capital. The natural capital component will represent the land and the environment, which ultimately provides for or limits humans and the economy.
Hazards and Disasters
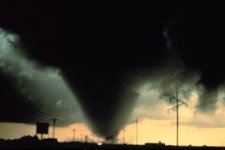
Figure 2.a.3
Tornado
There are a range of different hazards such as geologic, atmospheric, or anthropogenic hazards that subsequently cause natural or human induced disasters. Some of these hazards include:
Geologic Hazards
- Earthquakes
- Floods
- Volcanic Eruptions
- Tsunamis
- Landslides
Atmospheric Hazards
- Hurricanes
- Tornadoes
- Droughts
- Severe thunderstorms
- Lightening
Other Natural
Hazards
- Insect infestations
- Disease
- Wildfires
Anthropogenic
(Human Caused) Hazards
- Exposure to hazardous substances
- Nuclear
- Radon
- Mercury
- Asbestos
- Acid rain
- Ozone layer destruction
- Global warming
- Terrorist attack
Another assumption for the model is that disasters, whether they are natural or anthropogenic, generally cause human death and decrease the natural capital of the land.
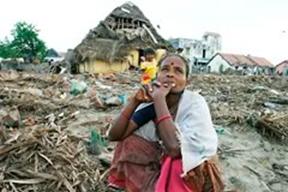
Figure 2.a.4
After the December 2004 Tsunami
Population
The vulnerability of a population to disasters depends on a number of factors such as:
- Proximity to the event
- Population density
- Scientific understanding of the hazard
- Disaster preparedness
- Construction of infrastructure
- Existence of early-warning systems
- Cultural factors
- Public education and awareness
- Economy
Developing countries are generally more vulnerable to hazards than are developed countries due to lack of understanding, education, and infrastructure. Poverty is also a key factor in vulnerability to disasters since poverty leads to poor infrastructure, increased population density, and development and habitation on susceptible land.
In this model, we will assume that as GDP (gross domestic product) or the wealth of a nation increases, the birth rate decreases. In general, as a nation’s wealth increases the amount of money spent on the education increases. This in turn, subsequently causes a decline in birth rates.
Another assumption is that as population growth increases, human capital increases. In addition, as population increases, this puts added pressure on natural resources and therefore decreases natural capital.
Building the Model
To model the
connections between natural capital, human capital, and economy, first
determine the number of stocks ![]() in the model and place them on your STELLA
workspace. Next, make the relevant connections between the stocks using the
flow symbols
in the model and place them on your STELLA
workspace. Next, make the relevant connections between the stocks using the
flow symbols ![]() ,
and add the appropriate converters
,
and add the appropriate converters ![]() and connectors
and connectors ![]() .
When the model structure has been fully laid out, assign the values given
below. Switch to modeling mode by turning the Globe into the X2
icon.
.
When the model structure has been fully laid out, assign the values given
below. Switch to modeling mode by turning the Globe into the X2
icon.
Stock #1: GDP
Initial Value = 100,000 {dollars}
Inflows
- Capital = (Natural_Capital*10) +Human_Capital {dollars/yr}
Outflows
- Income
= GDP*0.01 {dollars/yr.}
Converters
- Natural Capital = 1000/((Disasters)+(Population*.0001)){dollars/yr.}
- Human Capital = Population*.25 {dollars/yr.}
Stock #2: Population
Initial Value = 10,000 {People}
Inflows
- Births = Population*Birth_Rate {people/yr}
Outflows
- Deaths
= Population*(Death_Rate+Disasters*(.001))
{people/yr}
Converters
- Birth Rate = IF(0.4-(Income*0.0001))<0.2THEN(0.2)ELSE(0.4-(Income*0.0001)){1/yr.}
- Here you are creating an IF, THEN statement that ensures that the Birth Rate of the population does not go below 0.2, which is near replacement level.
- Death Rate = 0.201 {1/yr.}
- Disasters
= Graphical function (TIME)
- Create
graphical function of disasters over 200 years. (See instructions
below.)
- Note:
Disaster rate must always be above zero.
Connectors
- There are also twelve connectors that need to be added to the model.
Create Graphical Function
To run a model with a converter that changes rate over time, we need to define it graphically (as opposed to a mathematically). Click on and open the converter of interest, and then select and click on the TIME function in the Built-ins list or type in TIME in the equation box. (You must first delete the value in the equation box.)
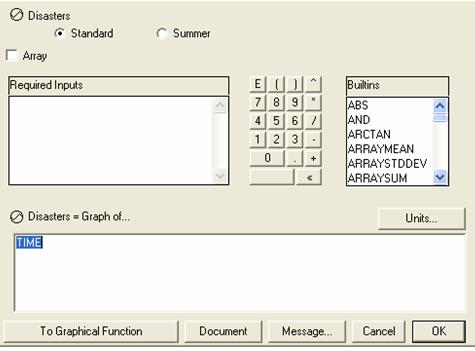
Figure 2.a.5
Become graph function
Now click on Become
Graph to get to the graphical function. Notice that the X axis is TIME and the Y axis is the converter. To alter the relationship in
the graphical function, you can drag the mouse over the grid and create a line
graph, or type in the desired rate converter in the right hand column. For
the first model, explore how Population and GDP change when natural disasters
occur at an equally low rate throughout the 200-year period. Make sure your
Time spans from 0.00 to 200 years. Choose 13 Data Points. Next, in the
Disasters column, type in 10’s for the entire column of numbers. You can do
this quickly by highlighting the numbers in the Disaster column and then
putting in 10 in the Edit Output box. This gives you a constant number of
disasters over the 200 year period.
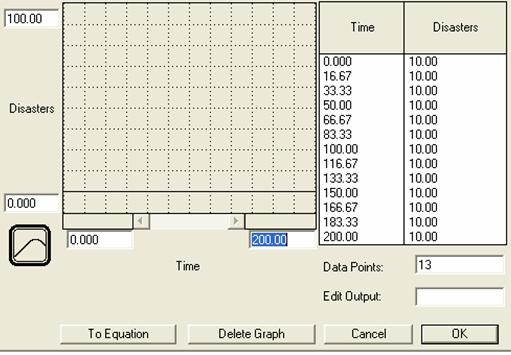
Figure 2.a.6
Graphical function
Once you have the complete model with all of the components
added to the system, create a graph ![]() of the Population and GDP stocks. Overlay the
natural disasters converter to see how disasters affect population growth and
GDP. Change the Run Specs so that the simulation runs from 0 to 200, using a
time step (DT) of 1 year.
of the Population and GDP stocks. Overlay the
natural disasters converter to see how disasters affect population growth and
GDP. Change the Run Specs so that the simulation runs from 0 to 200, using a
time step (DT) of 1 year.
Your first graph should look something like Figure 2.a.7.
Figure 2.a.7
Graph of GDP and population growth with a steady rate of disasters
Question
2.a.1
Why do we see a drop in the population as GDP increases?
Question
2.a.2
Explore the four major assumptions of the model. How realistic are they? What are the downsides of making these assumptions? Find an example of an actual human population from which one of your assumptions could have been drawn. Make sure to cite your source.
Now explore how population and GDP change by altering your disaster rate. Change disasters to represent a hump shaped distribution such that disaster rate starts out low, increases rapidly, stays high for a period of time and then rapidly decreases. Note: you may want to increase the length of your model simulation (i.e. run specs) to see this relationship.
Your graph should look something like Figure 2.a.8.
Figure 2.a.8
Graph of GDP and population growth with a humped shaped distribution of disasters
Question
2.a.3
If disaster rate is high then decreases rapidly, how long does it take for Population and GDP to recover?
Next change natural disasters to represent a more realistic distribution of disasters. Use Figure 2.a.9 to create your next graph for disaster rate.
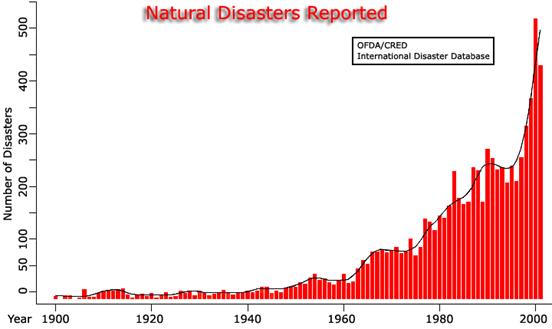
Figure 2.a.9
Number of natural disasters reported from 1900 to 2005
Question
2.a.4
What trends do you see in population and economy under this scenario? What would the disaster rate have to be to make the population or economy crash?
Now alter the disaster rate to have sporadic changes in the rate of disasters over the 200 year time period.
Question
2.a.5
How does the recovery time for population and GDP change as the magnitude of the disasters change?
Question
2.a.6
If you had the power, what policies or programs would you implement to improve preparation, response and recovery from disasters?
Sources
http://www.millennium-ark.net/News_Files/UN_Images/disasters.1900-2001.w.gif
http://www.epa.gov/greenkit/images/tornado1.jpg
http://www.tulane.edu/~sanelson/geol204/hazardousgeolproc.htm