Unit 1. Introduction
to Concepts and Activities
In this first unit we
examine fundamental aspects of scientific reasoning and systems. Activities chapters offer introductions to
the approaches used in subsequent units.
What is the Scientific Method?
Researchers investigate problems and phenomena in science using a body of techniques called the scientific method. Although the investigative process varies slightly by scientific field, the general method of inquiry that researchers use is similar. There are four mains steps in the scientific method, which can form a loop (Figure 1.1):
Figure 1.1
Scientific method loop
http://www.biorap.org/pix/photo_sungraph.gif
1. A problem or phenomena for investigation must be observed and described. A question to examine must be developed.
2. A hypothesis to explain the phenomena must be developed using the laws of reason. This hypothesis must be limited to the cause and effect relationship in a specific situation. This involves developing a prediction for the outcome of the question that was posed in step 1 based on what is currently known. If a hypothesis cannot be tested experimentally, it cannot qualify as a scientific theory.
3. Unbiased and objective experimental tests must then be designed to examine and answer the question and prediction that was posed using empirical, measurable evidence. Tests should be designed to clearly verify or refute the hypothesis. Several independent researchers, carefully noting the experimental steps, scientific evidence, and results, should conduct experiments so that other independent researchers can replicate and verify the data. Replication of the experiment and results gives strength to a given hypothesis and allows other scientific inquiries to be built upon the results of the experiment.
4. Conclusions about the experimental results can now be drawn. The hypothesis and results of the experiment can then be used to develop new questions and hypotheses (return to step 1) about other problems to gain further knowledge, can add to the general knowledgebase about a subject area, or can be used to generate quantitative estimates of other related research phenomena. Conclusive results from many experiments testing a hypothesis or a group of related hypotheses can then be used to develop scientific theories or laws.
Let’s examine a real world example to see how the scientific method may be applied (Figure 1.2). 1. First, assume that go to take a shower one morning and discover that there is only cold water coming from the tap. Your question might be, “Why is no hot water coming from the tap?” 2. Your first hypothesis might be, “There is no hot water because the pilot light on the hot water heater has blown out.” 3. You would then go and make an observation (i.e. collect data) to see whether the pilot light was actually blown out. 4. If you discover that the light is out, you might light it to see if that fixes the hot water problem. If lighting the pilot light solves your hot water problem then you have answered your question and supported your hypothesis that the pilot light was responsible for the lack of hot water. However, if you discover that the pilot light is already on, you would develop another hypothesis, such as, “The thermostat on the hot water heater is broken.” Then you might replace the thermostat to see if that fixes the problem, and so on.
Figure 1.2
Four steps of the scientific method
http://www.biologycorner.com/resources/scientific_method.gif
How are systems impacted by feedbacks?
A system is comprised of variables or elements that are related to one another. Elements that lack relationships to other variables cannot be part of the system. Since variables within a system are linked to one another, alterations in one variable often result in effects for other variables. This concept is the foundation of the ISEE STELLA modeling program used in the activities section of this text to explore systems and their feedback mechanisms. Feedbacks, or more commonly thought of feedback loops, can be thought of as a process in which part of the output of the system is returned to the input. This extra input then further increases or decreases the effects of the output (Figure 1.3).

Figure 1.3
Feedback loop
Both positive and negative feedbacks occur in nature. Any change in the environment leading to additional system response is the result of a positive feedback mechanism. In a positive feedback loop, the feedback response generally increases the input variable and causes the output to respond more in the same direction. Therefore, positive feedbacks tend to accelerate a process. Ocean warming provides a good example of a positive feedback mechanism (Figure 1.4). The ocean is an important sink for atmospheric CO2 from surface water absorption. As atmospheric CO2 concentration increases from fossil fuel combustion, it warms the atmosphere. As air temperature increases, this warms the ocean temperature. The ability of the ocean to remove CO2 from the atmosphere decreases with increasing temperature. Therefore, the oceans inability to absorb CO2 in a warm atmosphere further increases the CO2 concentration in the atmosphere, which leads to more warming.

Figure 1.4
Positive feedback loop
Another example of a positive feedback is the ice-albedo feedback mechanism. Try sketching out this feedback loop on your own. As the concentration of CO2 increases in the atmosphere from fossil fuel combustion, atmospheric temperatures increase. Warmer air temperatures result in an increase the rate of glacier and sea ice melting. As the ice melts, it changes the Earth’s reflectivity or albedo; the underlying ocean or land has a lower albedo (less reflectivity) than the ice (higher reflectivity) and thus an enhanced ability to absorb solar radiation. As the Earth’s albedo decreases, the surface will absorb more radiation and increase surface temperatures, thus melting more ice and further decreasing Earth’s albedo. If positive feedback loops are not controlled by a negative feedback mechanism, they can develop into vicious circles, which run out of control and eventually cause the system to collapse.
A negative feedback mechanism is a change in the environment that leads to a process that mitigates or stabilizes the output in a system. Therefore, negative feedback mechanisms tend to slow down a process. Let’s examine a possible negative feedback mechanism using atmospheric cloud cover as an example, starting with an increase in atmospheric CO2 concentration from fossil fuel combustion, which causes an increase in atmospheric temperature (Figure 1.5). The temperature increase then causes greater evaporation on the Earth’s surface, thus the presence of more water vapor in the atmosphere. This happens because the amount of water vapor in which the atmosphere can hold increases exponentially with temperature; therefore, increases in atmospheric temperature can produce large increases in atmospheric water vapor. The increase in water vapor may then increase high cloud cover and atmospheric albedo (thereby increasing the refection of solar radiation back into space) and subsequently cooling the atmosphere, producing a negative feedback effect. You can visualize the location where the feedback mechanism is mitigated as the arrow that has a circle on the end (Figure 1.5). This signifies that the response goes in the opposite direction or mitigates the output (i.e. cooler atmosphere instead of warmer atmosphere).

Figure 1.5
Negative feedback loop
What is the difference between correlation and causation?
As a student of the sciences, it is important that you understand the difference between correlation and causation. This inference will be especially useful as you do the ArcGIS activity section of this text because many erroneous causal links can be drawn from this type of dataset. People often make the mistake of assuming that if two things are correlated, there must be some causation involved in the relationship, which is not necessarily the case.
Correlation refers to the strength and direction of a linear relationship between two variables. For example, if short students received higher scores on a class exam than tall students, there would be a correlation between height and exam scores (Figure 1.6). However, this does not imply a causal link between height, and test scores, as short people are not necessarily smarter than tall people. The actual cause of the correlation may be caused by a third factor, like gender for example, where females, who tend to be shorter, may have done better on the exam then males. Alternatively, short students sitting closer to the front of the classroom, and in turn paying closer attention to the professor, may cause the correlation observed between height and test score. On the other hand, the relationship could be merely coincidental, and the correlation really does not give any information about the causality between the variables. To determine whether there is an actual cause and effect relationship between two variables that show a correlation, a scientific investigation using the steps of the scientific method, must be completed.

Figure 1.6
Correlation plot
Why are we concerned about global change?
Looking back on Earth’s long history we find that change is an integral part of our world. Among continuing changes we formed oceans and continents, created an atmosphere and planetary interior that protects the surface from life-threatening heat and radiation, and produced a powerful species that can force its own environment (yes, you). Why then the concern about global change, given its record of success. In this section we illustrate aspects of change using climate as an example.
There are three key aspects of climate change that we need to recognize: the unprecedented rate of climate change, change in the mean of events, and change in the variance or variability of events. Rate refers to a quantity of something measured relative to another quantity; for example, fifty miles per hour is a rate of speed, with distance traveled measured with respect to time. The arithmetic mean is more commonly known as the average. Building on the speed example, one’s average driving speed may be fifty miles per hour, but you are probably not traveling at fifty miles per hour for the entire time; you speed up to pass and slow down to turn or stop. Therefore, your speed has a variance, which describes the variability around the mean.
Rate of Change
Earth has been a dynamic planet since its formation, with an
ever-changing climate. However,
scientists today are concerned with today’s rapid pace of climate change,
rather than with the absolute magnitude of change. For example, in the past
600,000 years, CO2 concentrations in the atmosphere have varied
around 240 parts per million (ppm), leading to today’s distribution of the
world’s plant and animal species. Throughout that time CO2 concentrations
never surpassed 300 parts per million (ppm). But fossil fuel combustion since
the mid 20th century has increased the current CO2
concentration to 381 ppm and this is expected to double within a century. This
change reflects an unprecedented rate (doubling in 100 or 200 hundred years,
rather than over millions of years), which catastrophically affects modern
life. As a result of this change, we expect a substantial increase in global
mean surface temperature of approximately
Changing the Mean
Many events follow a bell-shaped or normal distribution
pattern. Normal distributions are symmetric with the majority of events
concentrated in the middle and lower numbers concentrated in the tails. On most
days, temperatures on Earth are close to average (near the center of the
distribution), but on some days temperatures are hotter than average and on
other days colder than average (closer to the tails). However, since the start
of the industrial revolution human activities have increased the concentration
of heat trapping greenhouse gases in the atmosphere [carbon dioxide (CO2)
by 30%, methane (CH4) by 145%, and nitrous oxide (N2O) by
15%], which is increasing Earth’s average temperature. Global mean surface
temperature has increased 0.5-
Change in Variance
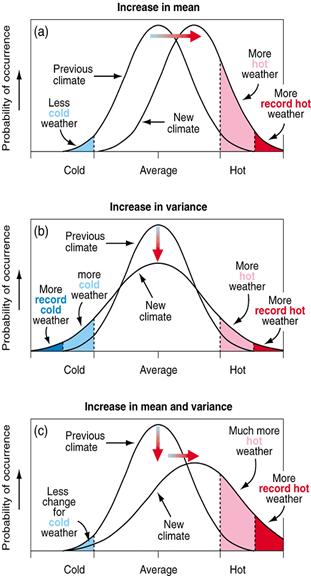
Whereas an increase in the mean causes a greater frequency of (extreme) hot events, this does not necessarily indicate any change in the temperature variability around the mean. Assume for a minute that there is no change in the mean temperature, to examine how a change in temperature variability would impact climate. If climate change alters the variability around the mean it alters the distribution such that fewer events occur near the center of the distribution and more events occur near the tails (Figure 1.7.b). This stretches out the distribution curve causing an increase in the probability of both hot and cold extreme events. There is evidence of this type of behavior with regard to precipitation, whereby the frequency of extreme drought and flood events has significantly increased around the world. Now consider that changes in temperature occur with increases in both the mean and the variability (Figure 1.7.c). This would increase the probability of record breaking, extremely hot temperature events by a substantial amount. Since there is evidence of both changes in climate variability and mean events, scientists expect that in the future more powerful storms, long heat waves, and other extreme weather events will regularly occur, while mean temperature change may be relatively small.
|
|
Figure 1.7 The effect of change
illustrated using global temperatures.
Change in mean (a), change in variance (b) and change in both mean and
variance. http://grida.se/climate/ipcc_tar////////wg1/fig2-32.htm |
Last
update: 2/1/2008 9:50 AM