Appendix I.
The Modeling Interface
When STELLA starts up, you will have a blank page ready for
a new model. To get into modeling mode, click once on the globe icon ![]() on the left hand side of your screen, so that
it changes to a X2 (Chi-square) symbol
on the left hand side of your screen, so that
it changes to a X2 (Chi-square) symbol ![]() .
You are now ready to start modeling.
.
You are now ready to start modeling.
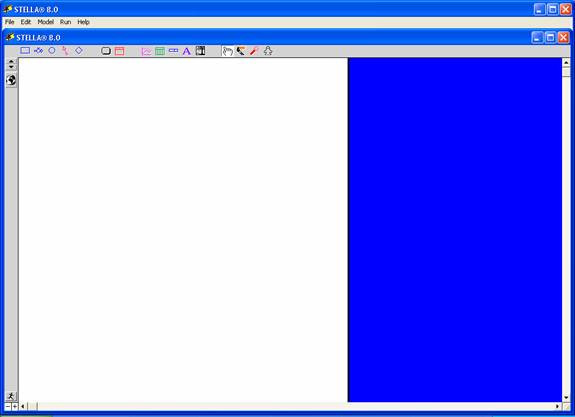
Figure AI.1
STELLA modeling interface
Model Components
![]() Stock
– Stocks are the state variable of interest.
Stock
– Stocks are the state variable of interest.
![]() Flows
- Changes in stocks are modeled with the flow tool. Flows go into or out of stocks.
Flows
- Changes in stocks are modeled with the flow tool. Flows go into or out of stocks.
![]() Dynamite
- If you make a mistake, click and drag the dynamite icon on top of the offending icon to blow it up.
Dynamite
- If you make a mistake, click and drag the dynamite icon on top of the offending icon to blow it up.
![]() Converters
-Change relationships between stocks and flows..
Converters
-Change relationships between stocks and flows..
![]() Connectors
– Connectors allow information to be passed between variables.
Connectors
– Connectors allow information to be passed between variables.
![]() Ghosts
- Ghost icons are used indicate that the value of the icon that is ghosted is
the same as the original. Ghost icons are used primarily for aesthetic
purposes, to improve the legibility and comprehensibility of a model (avoiding
the "spaghetti" that accumulates when there are too many connectors
crossing each other).
Ghosts
- Ghost icons are used indicate that the value of the icon that is ghosted is
the same as the original. Ghost icons are used primarily for aesthetic
purposes, to improve the legibility and comprehensibility of a model (avoiding
the "spaghetti" that accumulates when there are too many connectors
crossing each other).
To use the ghost, click on the original icon, then click the ghost button and finally place the ghost icon in the desired location on the modeling page. The ghosted icon should look shadowy, with a dotted outline.
![]() Numeric
Display - This icon allows
you to see the numeric value of a selected variable at the end of the
simulation. To use, click on the icon and place in on your workspace.
Double-click on your empty display box and select the desired variable that
will be graphed. Make sure "retain ending value" is selected, and
leave other options at the default settings.
Numeric
Display - This icon allows
you to see the numeric value of a selected variable at the end of the
simulation. To use, click on the icon and place in on your workspace.
Double-click on your empty display box and select the desired variable that
will be graphed. Make sure "retain ending value" is selected, and
leave other options at the default settings.
![]() Graph
– The graph button is used to place a graph of the model simulation on the
workspace.
Graph
– The graph button is used to place a graph of the model simulation on the
workspace.
![]() Run
– This button can be used to run the model simulation.
Run
– This button can be used to run the model simulation.
![]() Sector
Frame – This allows the user to move between different layers of the model
interface.
Sector
Frame – This allows the user to move between different layers of the model
interface.
![]() Table
Pad – The table pad is used to add data tables to the model.
Table
Pad – The table pad is used to add data tables to the model.
![]() Text
Box – This button allows text boxes to be added to the modeling space.
Text
Box – This button allows text boxes to be added to the modeling space.
![]() Graphics
Frame – This button allows graphics to be added to the modeling space.
Graphics
Frame – This button allows graphics to be added to the modeling space.
![]() Button
–Buttons, such as a run or stop button can be added to the modeling interface.
Button
–Buttons, such as a run or stop button can be added to the modeling interface.
![]() Paint
– Paint can be added to different icons to differentiate them
Paint
– Paint can be added to different icons to differentiate them
![]() Hand
– The hand can be used to select variables of interest.
Hand
– The hand can be used to select variables of interest.
![]() Up
and Down Arrows - To see the workings of the model, click on the down arrow
you see on the extreme left hand side of the screen. The icons created in the model
are translated into difference and differential formulas. Clicking on the up
arrow returns the viewer to modeling mode.
Up
and Down Arrows - To see the workings of the model, click on the down arrow
you see on the extreme left hand side of the screen. The icons created in the model
are translated into difference and differential formulas. Clicking on the up
arrow returns the viewer to modeling mode.
![]() Decision
Process Diamond – This button allow the addition of a decision to be made
by the model user at different points during the model simulation.
Decision
Process Diamond – This button allow the addition of a decision to be made
by the model user at different points during the model simulation.
Changing Icon Names
To change names of different icons, double click on the name bar.
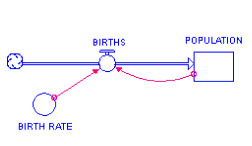
Figure AI.2
Population model, changing names of icons
Initial Values
Initially you will find question marks inside the stock, flow and converter icons. This is to remind you that an initial value is needed for each. Double-click on the icon, and a dialog box will appear asking for a value. Use the keyboard and enter the initial value or create the appropriate equation, then click on the units button and select the appropriate units from the listings and click OK. You should get into the practice of adding units in your models, which makes results much clearer.
Length of Simulation
To specify an amount of time for the model to run, we must first set the time specifications of the simulation (i.e. how long to run, what are the time intervals, etc.). Under the RUN pull down menu, select RUN SPECS. For example, in the dialog box, under length of simulation, you could set:
From = 0, To = 12, DT = 1, and Unit of Time = years. Click OK.
Creating Graphs
![]() To set up the viewing graph, click on the graph icon and then on your workspace area. When it is
displayed, double click it, and the dialog box showing the available variables
that can be plotted are shown on the left. If dialog does not appear, click
"define graph" on "Model" menu. Select the desired icon and
use the >> button to move
it to the Selected box. Click OK
to close the dialog box. Resize and move the window to a good location.
To set up the viewing graph, click on the graph icon and then on your workspace area. When it is
displayed, double click it, and the dialog box showing the available variables
that can be plotted are shown on the left. If dialog does not appear, click
"define graph" on "Model" menu. Select the desired icon and
use the >> button to move
it to the Selected box. Click OK
to close the dialog box. Resize and move the window to a good location.
To actually run the model, select RUN under the RUN menu or use the run icon button. After the data appears on your graph, you can click on the lock in the bottom left hand corner to keep your graph open on screen.
Connecting Flows and Stocks
Make sure flows are connected to stocks. Flows must be added to a model after stocks have been laid down. Flows and stocks are connected when the cloud icon disappears at the connection point and the arrow point is on the edge of the stock icon.
Figure AI.3
Connecting flows to stocks
To add a flow coming out of the stock, make sure that you start the flow inside the stock box and drag it out of the stock while holding down the mouse.
Change Over Time – Become Graph
To run a model with a converter that changes rate over time, we need to define it graphically (as opposed to a mathematically). Click on and open the converter of interest, and then select and click on the TIME function in the Built-ins list or type in TIME in the equation box. (You must first delete the value in the equation box.)
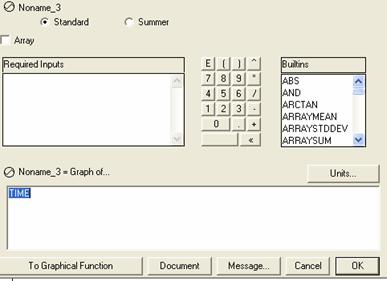
Figure AI.4
Become graph function
Now click on Become
Graph to get to the graphical function. Notice that the X axis is TIME and the Y axis is the converter. To alter the relationship, drag
the mouse over the line or type in the desired rate on the right.
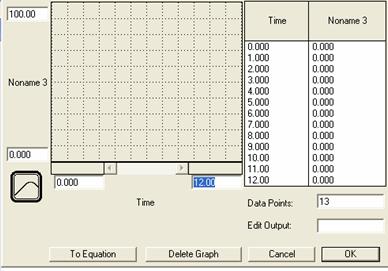
Figure AI.5
Graphical function
Trouble Shooting
· If you can't enter formulas, are you in modeling mode? If you double click on icons to put in initial values and find a blank screen, you are not in modeling mode. To get into modeling mode, click once on the globe icon on the left hand side of your screen, so that it changes to a X2 (Chi-square) symbol. You are now ready to start modeling.
· Are their mistakes in your model? Make sure that there are no typos in your model. You should avoid typing in any variable names when defining flows; instead select them from the list on the left box.
· Are your parentheses correct and balanced? Make sure that you have the flows going in the correct direction.
· Are your icons connected? Make sure the connectors between the icons exist and are connected to the correct icons.
· No graph appears when running? Have you defined the graph?
· Do you need to manually set the scale of the Y-axis so that the curves are scaled properly?
· Test and revise the model until it is running correctly.
Last
updated: 6/1/2006 10:49 AM