*Excel Energy Data: download here Introduction The primary sources of energy used in the U.S. today are fossil fuels, with over 85% of total energy coming from petroleum, natural gas, and coal. Nuclear and hydroelectric sources together provide about 12% of the total energy with additional minor, but locally important, amounts coming from geothermal, solar, wind, and other alternate sources. Fossil Fuel ResourcesQuestion 1: Look at “R/P Ratio” on the Oil - Proved Reserves, Gas –Proved Reserves, and Coal – Reserves worksheets. Take a look at the footnotes to determine what the R/P Ratio measures.
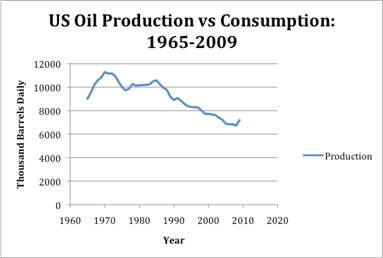
Click on the “Oil Production – barrels” worksheet in the energydata.xls file. Using Excel, plot US Oil Production from 1965-2009. To do this, select the rows containing the years and the US oil production, and click Insert->Chart. Select “Straight Lined Scatter” under the XY (Scatter) category. Years should be your x-axis, while thousands of barrels per day should be the y-axis. Be sure to add x and y axis labels, as well as a title, and name the data series as production in the legend. Your graph should look something like this now (depending on the version of excel you are using):
Right click on your figure, and select move chart, and move your chart to a new worksheet. Next, add US Oil consumption to this figure in order to compare consumption directly to production. To do this, right click on your chart and go to select data. Near the box labeled “series,” click add. Name the new data set “Consumption,” and set your x-axis and y-axis values as the cells containing the years and consumption values respectively. Click OK. Question 2:
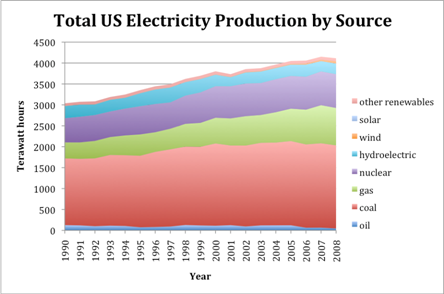
Comparison of US and German Electricity Production Click on the “Electricity Generation” worksheet. Here, you will find information about how much electricity is generated by source. The units here are terawatt hours. Let’s first analyze total electricity production in the US over the past 20 years broken up by category. Select cells B3 to U12, and click on insert chart. Select “stacked area” and click okay. After adding a title and axis labels, your chart should look like this:
Question 3: Make the same chart for electricity production in Germany, and answer the following questions (include both charts with your answers):
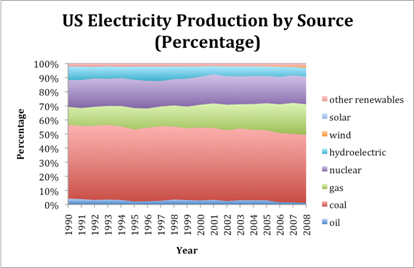
Let’s display the information in question 3c above in a different way. Select the same data range before to make a new chart, but instead of “stacked area” choose “100% stacked area. This chart shows the percentage of total electricity production from each source. Your chart for the US should look something like this after labeling it:
Question 4: Make the same chart for Germany and compare them. Include both charts in your word document and answer the following question:
Renewable Energy ResourcesQuestion 5: Click on the renewable calculations worksheet in the energydata.xls document. Under question 1, the total average solar energy reaching the Earth’s surface, and the area of Earth’s surface required to meet the average global power demand (assuming that after installation, a solar array can convert only 5% of the solar energy reaching the panels into electricity) are calculated. In the spreasheet, only change the values highlighted in yellow.
Question 6: A recent article suggests 40-85 TW (1 TW = trillion Watts = 1012 Watts) of wind power might be readily available to produce electricity. How do these values compare to the average global power demand? Summary Question Assignment References and Useful Links |